
The Liquidity Way of Investing

The global economy is akin to a rain forest with countless species interacting with and dependent on each another.
Remove one and you begin a chain reaction with unintended or knowable consequences. Small economic influences converge into larger global trends and links the entire global structure into one dependent chain system.
This is why we need to see the flow of capital between all players for analysis of the whole complex global system and not just subset of parts of the economies.
Why Pinetree?
Unlike other trees, a Pine Tree does not lose their foliage throughout the year.

An efficient portfolio is the one that sails through summers of market volatility; without any significant erosion to the capital and is able to fathom and navigate through global asset allocations.
The Liquidity Way of Investing
The strategy we back tracks Global liquidity (G-7 Central banks) and invests based on direction/duration of capital flows. Money flows are critical to financial markets; geopolitics are important but they aren’t the main driver of asset markets over the medium term.
By liquidity we don’t mean the money supplies; but, it’s a whole set of money flows or funding flows i.e., credit that re-finances the whole economic system.
Market Returns Based on Liquidity
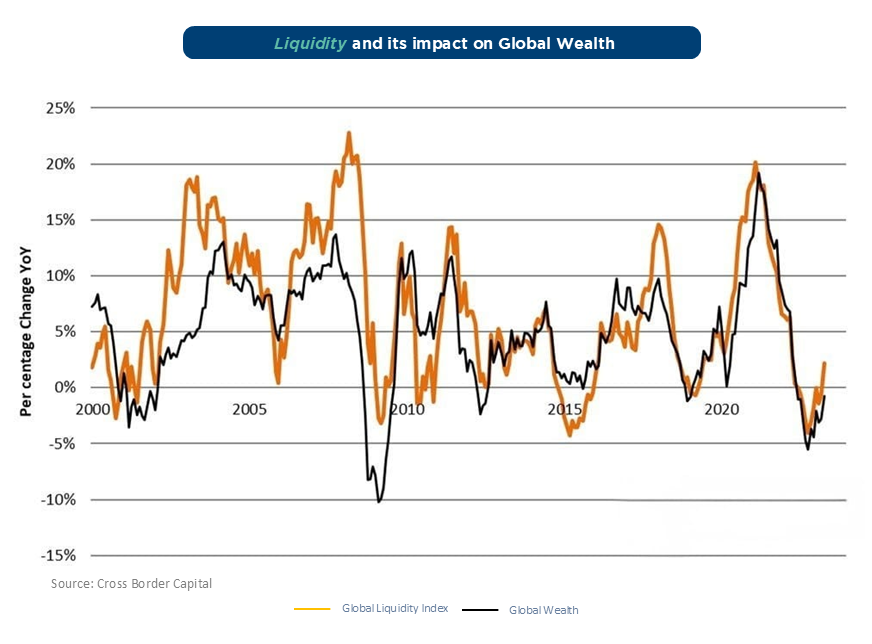
Central Banks respond to the market crashes by injecting liquidity that drives markets. The green line indicates the global liquidity over the years and the purple line is the Russel 2000 ETF or the World Stock index.
As we can seen when 'liquidity' is injected, market performance increases in the following months and goes to cash when liquidity is tightened, markets eventually bottom out the following months.
Strong divergence starts appearing from 2024 when economic indicators stopped responding to central bank directions in the US.
Core Strategy
Focus on Global Liquidity Flows

Top Down / Macro Driven Strategy

Global Asset Allocation Fund

Using US listed ETFs/ETNs/Stocks as Primary Investment

Low Volatility Using Cash Opportunistically

Absolute Return Strategy With Focus on Minimizing Drawdown
Liquidity Movement Over the Past Decade
-
1985 - 1992
Japan
1985 Plaza accord wherein explicit dollar depreciation was announced with capital moving to Japan in search of returns making Japanese Real Estate and Japan Equity markets as biggest beneficiary.
-
1990 - 1997
Emerging Markets
As the Gulf war started, the US Fed eased monetary policy again and the Dollar started depreciating. Capital moved into Emerging Markets and inflated asset prices creating a bubble which finally culminated into the Asian crisis in 1997.
-
1998 - 2000
Dot Com Bubble
Bursting of EM bubble and LTCM crisis led to Fed easing policy rates again for a short period. This time the beneficiary were Tech stocks which got the added benefit of Y2k related excess liquidity thereby inflating their valuations.
-
2000 - 2010
Emerging Markets
Y2K Tech bubble bust + Sept 9/11 crash led to Fed easing again. This co-incided with China’s entry into WTO which led to the beginning to capital & production moving to Emerging economies like China.
-
2010 - 2020
United States
Post GFC, Fed eased rates but dollar retained its strength due to rising shale oil production. This decade was characterized by growth in US GDP and Equity as capital moved to US growth stocks.
-
2020 - Present
US is energy independent and will slowly look at vacating the role of global reserve currency as it is not in their interest anymore, but no nation is ready to step into the shoes of US. Will this lead to a multi polar world?
-
1985 - 1992
Japan
1995 Plaza accord wherein explicit dollar depreciation was announced with capital moving to Japan in search of returns making Japanese Real Estate and Japan Equity markets as biggest beneficiary.
-
1990 - 1997
Emerging Markets
As the Gulf war started, the US Fed eased monetary policy again and the Dollar started depreciating. Capital moved into Emerging Markets and inflated asset prices creating a bubble which finally culminated into the Asian crisis in 1997.
-
1998 - 2000
Dot Com Bubble
Bursting of EM bubble and LTCM crisis led to Fed easing policy rates again for a short period. This time the beneficiary were Tech stocks which got the added benefit of Y2k related excess liquidity thereby inflating their valuations.
-
2000 - 2010
Emerging Markets
Y2K Tech bubble bust + Sept 9/11 crash led to Fed easing again. This co-incided with China’s entry into WTO which led to the beginning to capital & production moving to Emerging economies like China.
-
2010 - 2020
United States
Post GFC, Fed eased rates but dollar retained its strength due to rising shale oil production. This decade was characterized by growth in US GDP and Equity as capital moved to US growth stocks.
-
2020 - Present
US is energy independent and will slowly look at vacating the role of global reserve currency as it is not in their interest anymore, but no nation is ready to step into the shoes of US. Will this lead to a multi polar world?
Past Performance of the Investment Manager
Sharpe
1.22
Performance since inception (Aug' 2022 - June' 2026)
99.88%
Max Drawdown
10.40%
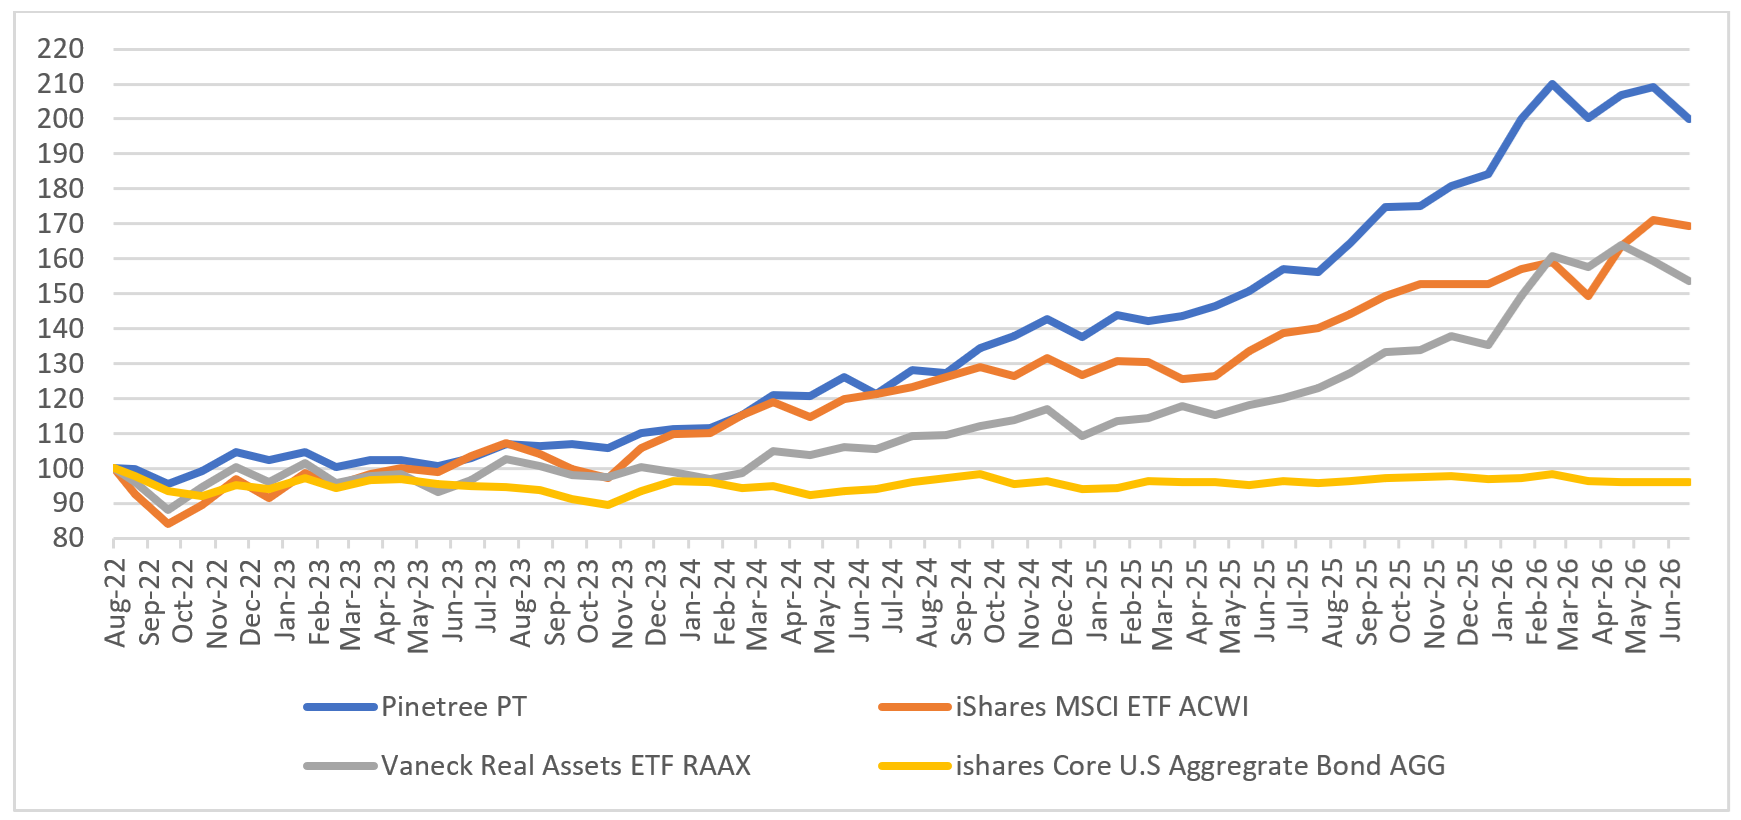
Note: The Pinetree NAV considered is after operating and management fee but before adjustment for performance fee(s), and other charges, if any. Returns are calculated on a point to point basis.
Media

Watch Video

Watch Video

Watch Video
The major thing we look at is liquidity as a combination of an economic overview and how the Fed is responding to that economic situation.
Stanley Druckenmiller | 1998