Our Calls, Graded
Before we make the case for Indian manufacturing, we should account for the calls we have already made.
In May 2024, in an interview with NDTV Profit, we backed electrification, defence, tourism and wealth management. Here is how each has fared in the two years since.
Why PineTree Macro’s Ritesh Jain Is Betting On India Manufacturing Boost
-
Defence


Played out ✅
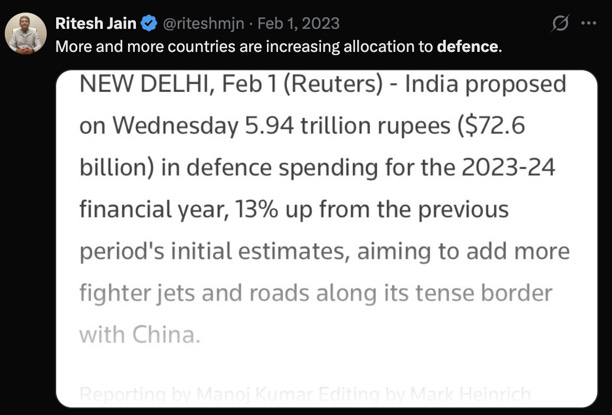
As a sector, defence delivered on the fundamentals. The government’s push for indigenisation, combined with a surge in exports, translated into tangible order books rather than just policy announcements. Domestic defence production reached a record US$21 billion in FY26, while the medium-term opportunity remained substantial. Jefferies estimates India’s defence opportunity at US$100 - 120 billion over the next five to six years, with the sector projected to grow at approximately 13% annually through FY2030.
This is the “money spent, not money announced” test, and defence passed it.
-
Electrification


Played out ✅
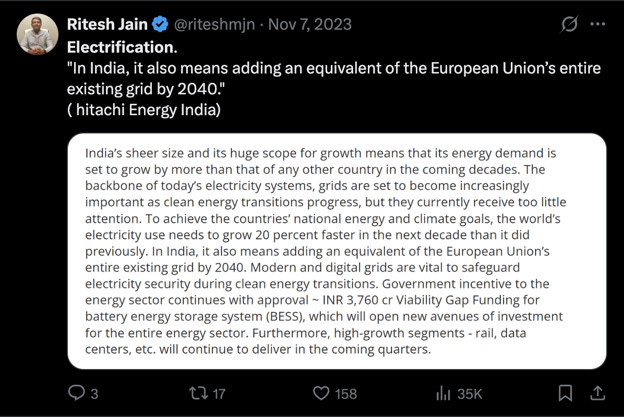
Electrification was one of the highest-conviction themes in our portfolio, and it performed exceptionally well.
Over this period, India’s rising power demand, grid expansion, transmission upgrades, and investment in transformers and cabling evolved from a policy narrative into a full-fledged capital expenditure cycle. On the demand side, the numbers continue to strengthen. Peak power demand reached a record 271 GW in May 2026 during a severe heatwave, leaving minimal operating headroom. Looking ahead, the International Energy Agency (IEA) expects India’s electricity consumption to grow by approximately 6.4% annually through 2030, the fastest pace among major economies, driven by air-conditioning demand, data centres, and the electrification of transport.
The equipment order books tell the same story, with a structural acceleration in transformer and grid ordering that began around FY23, and domestic manufacturers running at high capacity and transformer supply struggling to keep pace with demand.
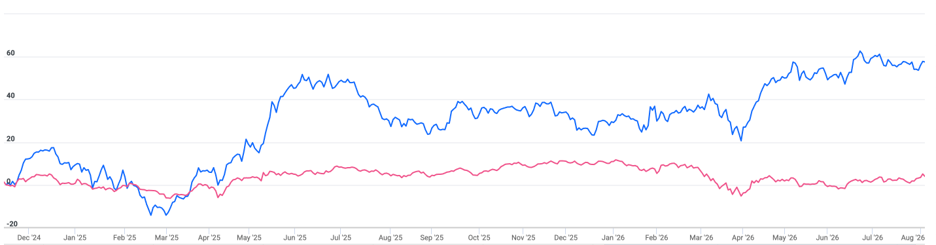
The scale of the outperformance has been remarkable. The electrification and capital goods complex have compounded at roughly 22% annually over the past three years, compared with around 8% for the Nifty 50 over the same period.
As macro investors, we do not discuss individual securities. However, many of the leading companies across the electrification value chain have delivered multibagger returns during this cycle.
The BSE Power Index has also significantly outperformed, reflecting broad-based strength across power generation, transmission, distribution, and manufacturers of electrical equipment.

Returns for BSE Power Index (blue) vs. Nifty50 (red)
-
Tourism



Not played out yet ❌
On the ground, the direction is real: pilgrimage-led travel, hotel additions in temple towns, better connectivity, and rising footfall at major religious sites have all continued.

India’s hospitality sector drew over $500 million of investment in 2025, up 67% on the year, with Tier II and III cities taking 71% of all new branded hotel signings. As an economic theme, it is doing what we expected, only slowly, which is the nature of infrastructure-led demand: airports, four-lane roads, and hotel keys take years to build even when the pilgrims are already arriving.
Although the sector has worked, the market has not rewarded it.
Two things explain the gap. The first is that slow-burn infrastructure themes rarely reward you on the market’s timetable; the spending is real but the earnings arrive in years, not quarters, and a market that had already priced in the story sold the wait. The second is entry price. Tourism was a crowded, well-liked theme going into this window, and a good story bought expensively still has to grow into its valuation before it pays. That is the honest lesson of this one: being right about the sector is not the same as being right about the stock, and the difference is almost always what you paid at the start.

Returns for Nifty India Tourism Index (blue) vs. Nifty50 (red)
-
Asset & Wealth Management
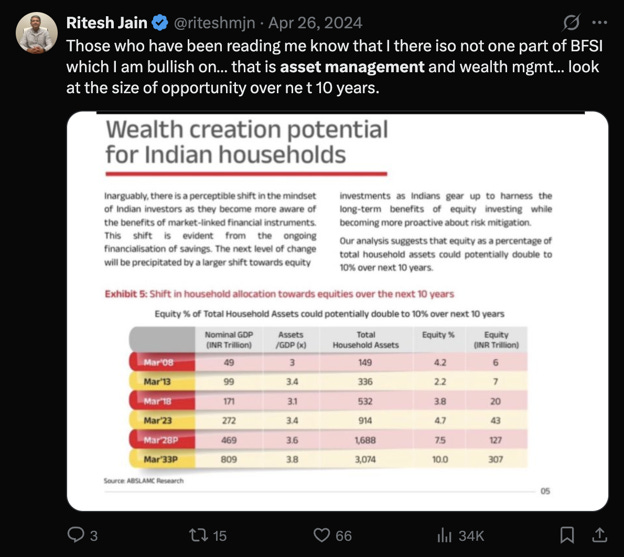
Played out ✅
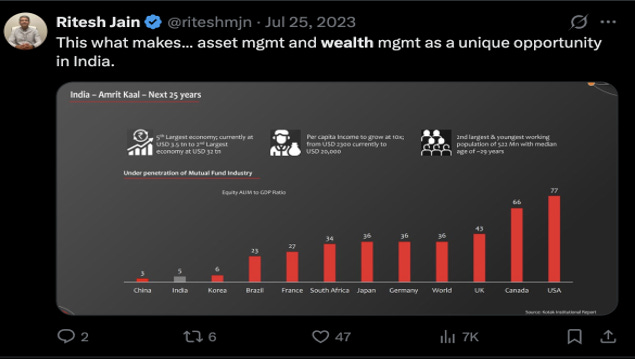
The sector thesis was both demographic and behavioural. As Indian households continued shifting their savings from idle bank deposits into financial assets, the businesses that sit at the centre of this ecosystem, including asset managers, stock exchanges, depositories, registrars, brokers, and wealth management platforms, benefited from an expanding, annuity-like stream of revenues. That “financialisation of savings” theme continued to play out over the period, reflected in record SIP inflows, rising investor folios, growing demat accounts, and stronger platform revenues.
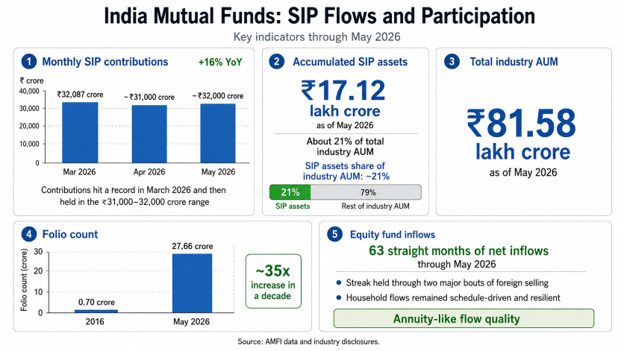
The market rewarded it clearly. The capital-markets complex, which the Nifty Capital Markets index now captures, returned roughly 12% compounded yearly over the past 3 years, well ahead of the Nifty 50 over the same stretch.

Returns for Nifty Capital Markets Index (blue) vs. Nifty50 (red)
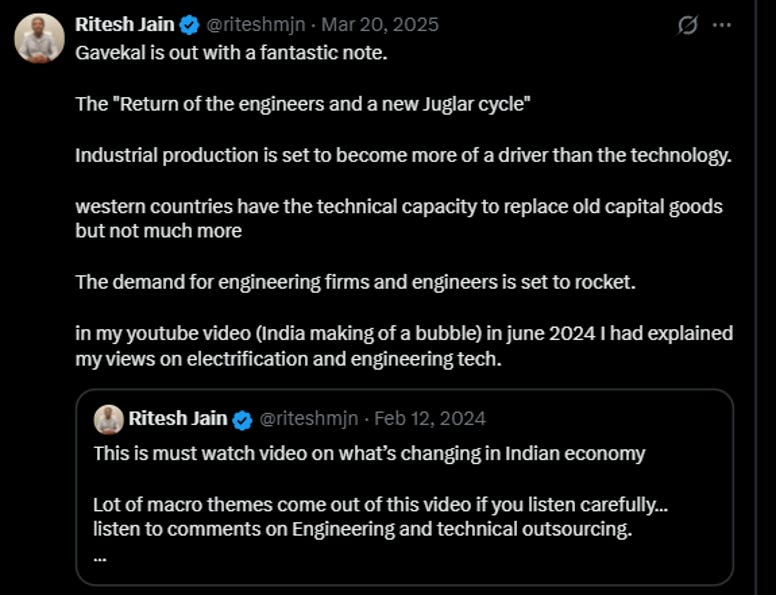
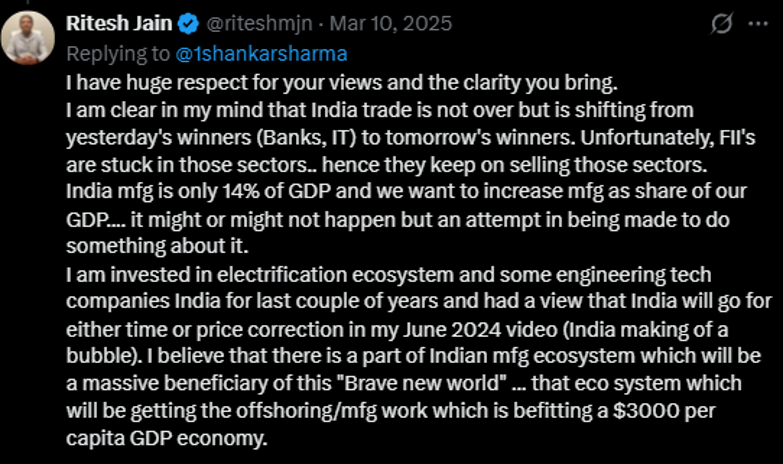
4. Engineering & Engineering Services (Another call we were bullish on)
Partially played out ⚠️
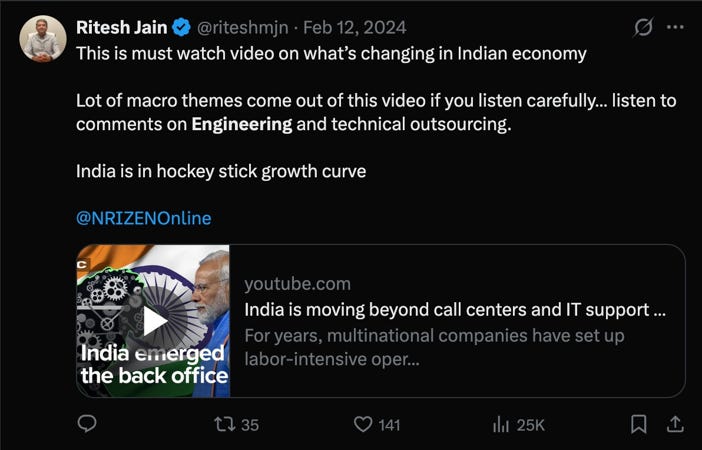
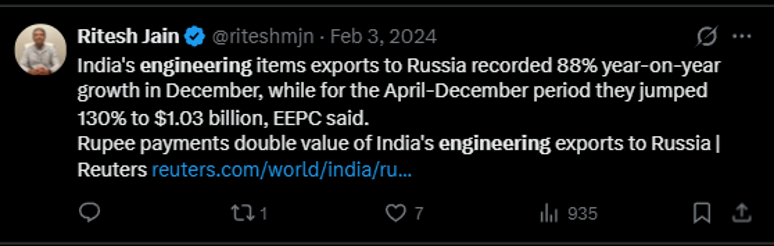
Let us start with the fundamentals. On the goods side, engineering is now the single largest component of India’s merchandise exports. Engineering goods shipments hit an all-time high of about $122 billion in FY26, up from roughly $70 billion a decade ago, and their share of total merchandise exports has climbed from about 20% to nearly 28%. That happened despite the Strait of Hormuz disruption in March 2026.
The higher-value half, engineering services, did even better on the fundamentals. This is the offshore design and R&D business, the work done inside the global capability centers and the listed engineering-services firms. India now hosts the majority of the world’s GCCs and delivers roughly a quarter of all outsourced engineering R&D globally. The ER&D services market is worth well over $130 billion and compounding at a double-digit rate, and the sector now employs more people in India, at higher average pay, than the country’s entire commercial banking industry.
The engineering-goods and broader manufacturing complex was rewarded. The listed engineering-services names are where the two came apart. The pure-play ER&D stocks fell sharply through 2026, some down 15 to 25% in the first few months alone, and the sector de-rated as a group. The reason is the single most important variable in this whole space right now: artificial intelligence. The market began to worry that generative AI compresses exactly the billable engineering hours these firms sell, and it re-rated their multiples downward on that fear, even as demand and headcount kept growing underneath. Brokerages cut forward earnings multiples across the sector, citing reduced pricing power rather than falling revenue.
Whether AI expands this industry or eats it, is the question the next few years answers.

Returns for Nifty India Manufacturing Index (blue) vs. Nifty50 (red)
Indian Manufacturing So Far
This quarter, the global rankings moved. India’s manufacturing output grew 2.5% quarter-over-quarter in Q1 2026, ahead of the United States and a contracting Germany, level with Japan, and behind only South Korea and Taiwan.

If all of that is true, the question is why manufacturing still sits well below its target of 25% of GDP?
Global demand has been soft. US tariffs still loom. China built a thirty-year head start that does not disappear because India shows up with a PLI scheme. And structural transitions, historically, take longer than one policy cycle to show up in GDP-share numbers.
None of that is an argument against the thesis. It is the reason the thesis is still available at a reasonable price. The more useful question is not why manufacturing has lagged, but what changes the trajectory from here.
It helps to remember that this is not the first time India has tried. The ambition to industrialise is almost as old as the republic, and the modern version of it, the push to lift manufacturing toward a quarter of the economy, has been official policy for well over a decade. Yet the share has barely moved. It sat around 15 to 17% of GDP twenty-five years ago, and it sits in roughly the same place today.
The reasons were mostly domestic, and they were structural rather than dramatic. Land was hard to buy and slow to convert. Labour law made large factories reluctant to hire at scale, so firms stayed small on purpose and never captured the cost advantages that size brings. Power was unreliable and expensive for the industrial user who needed it most. Moving goods across the country was slow and costly, and moving them through a port slower still. None of these on its own was fatal, but together they added a tax to every unit made in India, and that quiet tax was usually enough to send the order to a country that had solved these problems first.
There was also a matter of sequence. India built a services economy first, and did it so well that manufacturing was never the only path to growth the way it was for East Asia. Software, back-office and finance could grow without good roads or flexible factory labour, so the country leaned into what worked and postponed the harder, more physical transition. That was a reasonable choice at the time, but it meant the manufacturing base stayed shallow while China spent those same decades getting deep.
Two Tailwinds
-
Currency
The rupee has been through its sharpest real depreciation since the 1991 crisis, with the real effective exchange rate falling roughly 16% between December 2024 and April 2026. That is comparable in size to the 2013 episode, except it happened in sixteen months rather than three years. Against the yuan specifically, the currency that actually matters in a China+1 world, the rupee is down about 15% in the past year alone. An Indian exporter today carries a structural cost advantage they did not have eighteen months ago.
Back in May 2025 we made a simple argument about what could move the rupee:

That is more or less how it played out. Oil stayed below $80 for the rest of 2025 and the rupee held. Then oil broke above $80 this year, and the rupee depreciated. It was never the only force at work, but the swing variable behaved exactly as described.
-
Trade access
In four years, India has gone from one of the most agreement-shy major economies to holding preferential access to roughly $9 trillion of global imports. The UAE deal is the proof the model works: bilateral trade more than doubled to over $100 billion, with non-oil trade doubling too. The EU agreement, concluded this January, opens a market of 450 million consumers with 93% duty-free access. The UK CETA came into force this July.
We believe going forward, a combination of depreciated currency and free trade agreements spanning 38 countries will open up opportunities for manufacturing exports especially in spaces being vacated by China.
The Outlook Ahead
-
Electrification
The simplest case because the demand is not a forecast, it is already showing up. Peak power demand hit a record 271 GW during a May 2026 heatwave, and both the grid planners and the IEA expect it to keep growing around 6% a year through 2030. What makes this cycle different from the last one is what’s driving that growth: air conditioning, EV charging, and a category that barely existed last time, data centres.
Demand of that kind has to be carried physically, and India’s grid was not built for it. Moving planned renewable power from where it’s generated to where it’s used requires roughly $95 billion of transmission investment over the next several years. That’s the whole investment case in one sentence: the country has committed to building the renewable capacity, and now it has no choice but to build the wires, transformers and high-voltage links.
The newer and more interesting leg is exports. The US and Europe cannot build transformers fast enough for their own grid and data-centre buildout, and Indian manufacturers are starting to win that work directly rather than serving only the domestic market. When an Indian firm lands a transformer export order from a US hyperscaler, as one did early this year, that is the tell. It means the capability is now good enough to sell into the very markets that used to sell to India.
2. Defence
A decade ago, India was primarily a buyer. Today, it is beginning to establish itself as a seller, exporting defence equipment to countries that have no shortage of alternative suppliers.
Vietnam signed a BrahMos missile deal worth approximately ₹6,000 crore in mid-2026, while Indonesia is reportedly close to concluding a similar agreement. If completed, that would make three export customers in under two years, following the Philippines. Foreign governments committing real capital to Indian weapons systems is a stronger validation than any domestic budget allocation because they have actively chosen India over competing global suppliers.
This growing international demand is one of the reasons analysts are projecting defence earnings growth of around 30% annually for leading private-sector defence companies through FY28. Increasingly, the order book is being driven not only by domestic procurement but also by exports.
The forward leg to watch is the indigenous fighter programme, and it runs on two timelines. The near-term one is Tejas, where the binding constraint is engine supply. Deliveries depend on a steady flow of engines from GE, an American supplier, making it the one critical component of the “indigenous” supply chain that still relies on a foreign manufacturer. The long-term one is AMCA, India’s fifth-generation stealth fighter, which has cleared its design phase and shortlisted its private-sector manufacturing partners but is not expected to enter service until the mid-2030s.
The success of Operation Sindoor highlighted India’s capabilities in anti-drone warfare, with credible reports crediting the private sector for playing a key role in helping the Indian Armed Forces develop this capability. Looking ahead, both drones and counter-drone warfare are likely to become increasingly important as they reshape the nature of modern conflict.
Electrification and defence are the two themes in which we have the highest conviction, for the reasons outlined above. Two other themes that could also perform well are auto and auto components, where India’s established industrial base and the China+1 sourcing shift are driving export opportunities, with aerospace and defence representing the higher-margin adjacency. The other is pharmaceuticals, where the domestic opportunity lies in reshoring the production of active pharmaceutical ingredients (APIs) still sourced from China, while the larger prize is moving up the value chain into biosimilars and biologics. GLP-1 weight-loss drugs coming off patent later this decade represent the clearest near-term example of that opportunity. Both themes have the potential to be long-term winners.
Conclusion
The benchmark is a portrait of the India that already happened: banks, IT, consumer. The transformer makers, the defence exporters, the component suppliers and the biologics plants are barely in it. Owning the market and owning the transition are not the same trade.
But we said at the outset that it is easy to write a bullish note but harder to judge whether it is right. So here is what would prove this one wrong: if the rupee’s real depreciation is not enough, or if the trade agreements deliver market access without volume, with deals signed but export numbers remaining flat even two years later. Alternatively, if manufacturing’s share of GDP is still only 15 -17% in 2029, then the domestic frictions we described may have been the whole story all along.