Risk Analysis
This report analyzes the performance of PineTree Macro’s portfolio over the past year, since its inception. PineTree Macro makes investments based on macroeconomic signals and factors. This means the portfolio primarily consists of ETFs that track an industry or a country’s investments. The portfolio can be split into the following components:
- Global country specific ETFs – iShares Mexico, iShares Brazil etc.
- Industrial ETFs – iShares U.S. Aerospace & Defense, iShares U.S. Infrastructure etc.
- Macro ETFs – iShares 0-3 Month Treasury bonds, Simplify Interest Rate Hedge etc.
- Cash – USD (On Average 17.6% of the portfolio has been cash over the past year)
The wide variety of investments make the portfolio quite diverse which decreases the overall risk taken on by PineTree Macro. We can view the following correlation matrix to see how correlated the components of the portfolio are:
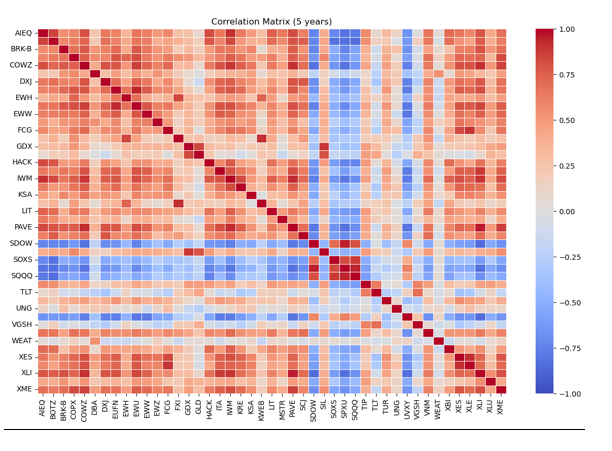
This matrix shows how each component’s returns vary with every other component’s returns on average, over the last 5 years. A positive correlation between 2 components shows that when one component has high returns then the other component is also likely to have high returns.
Note- The components of the matrix represent most of the ETFs that PineTree Macro has invested in over the past year. Some of these positions have been liquidated now. Some other assets were not included in the matrix as they were first issued after 2018.
Conversely, a negative correlation indicates that when one component has high returns, the other component has higher losses.
As the aim of investing is to make higher returns while minimizing risk, a portfolio that can return money while taking on minimal risk is the optimal goal. A portfolio with many low and negative correlations between components would be a good indicator of a diversified portfolio which takes on less risk, as the component’s returns move in opposite directions making sure you never lose all/most of your money.
Out of the 45 components there are a possible of 990 correlations and 438 of these are quite low (<0.25). This means 44% of the assets have low correlations, making the PineTree Macro portfolio diversified and decreasing the risk taken on. The portfolio also minimizes risk by keeping a large proportion of its investment as cash. Over the past year this has been about 17% on average.
Portfolio Performance Analysis
To analyze PineTree Macro’s performance, first we have to come up with a benchmark. The benchmark chosen in this case is a composite of Vanguard Total World Stock Index Fund (VT), VanEck Inflation Allocation ETF (RAAX) and Vanguard Total Bond Market Index Fund (BND) where we weight them equally:
Benchmark = (1/3)*VT + (1/3)*RAAX + (1/3)*BND
This is a good benchmark as it equally weights the most important assets that people invest in – stocks, bonds and inflation fighting assets (for example, commodities like gold).
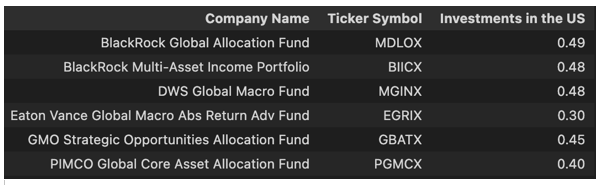
I also selected some relevant competitors to better assess PineTree Macro’s performance. These competitors are also global macro funds that make investments based on macroeconomic signals. I selected these based on their investment strategies and the proportion of assets they had invested in the United States, aiming for about 30% – 50% compared to PineTree Macro’s roughly 50%. I used Refinitiv Workspace to find these competitors and look at their investment compositions. I was able to find 7 such funds which are also being tracked publicly on exchanges. This is a list of the selected competitors:
When comparing PineTree’s performance over the past year against the benchmark and these competitors we get the following results:
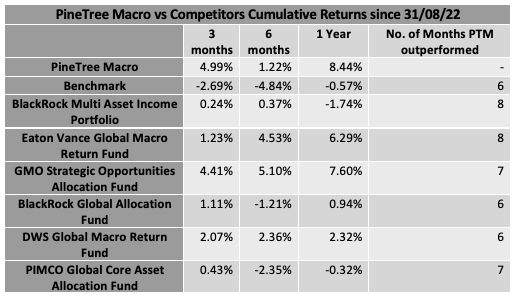
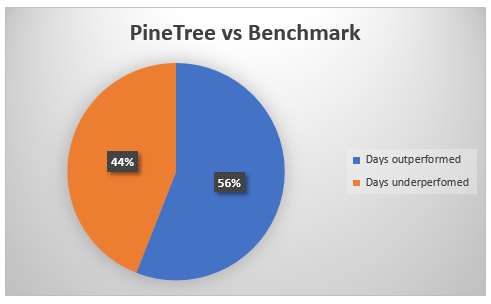
This table shows that PineTree Macro has outperformed all other competitors and the benchmark in terms of cumulative returns, over the whole year. PineTree Macro also had higher returns for 6+ months out of 12, versus the benchmark and the competitors. I have also looked at the daily returns of PineTree Macro and the benchmark, and I found that PineTree Macro beat the benchmark for 150 days out of 268. This can be seen in the pie chart below:
We can further examine PineTree’s portfolio and its competitors’ performances by seeing their risk weighted returns. We will do this by calculating a mean of the returns for all 12 months, and then annualizing it. We can see the results in the following table:
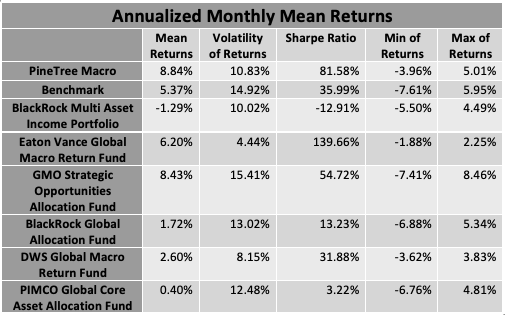
The Sharpe Ratio is calculated by dividing the Mean by the Volatility and it measures the risk weighted returns for a portfolio. A Sharpe Table of 100% indicates that a portfolio is performing as expected considering the amount of risk that it has taken on. PineTree’s Sharpe Ratio is 81.5% which shows that its returns are slightly under the expected amount for the risk the portfolio has taken on. However, we can also see that most other competitors, and the benchmark, have Sharpe Ratios far below 100% and the only benchmark that has outperformed PineTree Macro, in terms of risk weighted returns, is Eaton Vance Global Macro Allocation Fund.
How does PineTree Macro outperform other Macro investment funds
1. Low Volatility of Returns
From the table above we can see that PineTree Macro’s returns have a volatility of about 11% which is between the other competitors’ volatilities. This is still significantly lower than some of the other volatilities which are as high as 15.4%. As I explained above, PineTree Macro has a diversified portfolio with many assets which are weakly correlated with one another. This helps to reduce the volatility in returns. Further, a large proportion of the portfolio is cash, which helps to reduce the volatility in returns even further. This also makes the returns achieved more impressive as a large proportion of the portfolio has not been invested anywhere and is earning a relatively small amount of interest each month.
2. Different Investment Strategies
To see how PineTree Macro is outperforming other competitors I compared their cumulative returns and ran linear regressions of PineTree’s returns against the benchmark and each competitor. The cumulative returns over the year can be seen in the following graph:
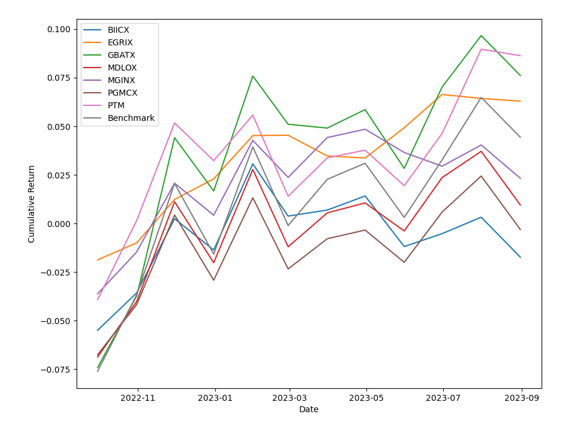
Here, it can be seen that the benchmark and most competitors move in the same directions as each other, that is they have spikes and falls at the same time. This indicates the competitors have a high correlation. This can also be seen by looking at the regression results and observing the value of beta (correlation). Most of the regressions have similar results so I will only show one here. Here is an example of the regression against BlackRock Global Allocation Fund:
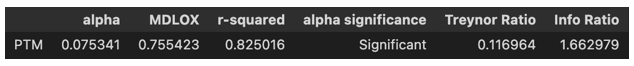
The ‘MDLOX’ value here represents the beta, which is high but less than 1. This means when the BlackRock Global Allocation Fund’s returns increase, PineTree Macro’s returns also increase, and this trend is followed across all competitors. This is expected as the competitors and PineTree Macro invest using broad macroeconomic signals.
PineTree’s superior performance can be explained by the high Info Ratio term in the regression. This ratio shows the excess returns that were captured by the PineTree strategy that the BlackRock Fund’s strategy (or any other benchmark) cannot explain. For most competitors this number is above 100% (166% in this case) which shows that a lot of PineTree’s returns are coming from its different strategy. This means PineTree might be investing using different ETFs and signals compared to its competitors.
When conducting regression against the benchmark we have a beta of 68%, which is still pretty high, and we have an Info Ratio of 142%. The slightly lower correlation, compared to the competitors, makes sense as PineTree and its competitors are focused on investing using macro signals whereas the benchmark is just tracking the value of a wide range of signals (which also includes macro related ones like inflation but other wider indices too). The Info Ratio here also indicates a different macro investing strategy taken on by PineTree Macro, compared to the benchmark which just tracks the composite value of some indices.
Conclusion
Over the past year PineTree Macro’s portfolio has performed very well when compared to its competitors, which also make investments using a macroeconomic strategy, and the benchmark. PineTree Macro had the highest cumulative returns over the year across all its competitors. It also outperformed every single competitor and the benchmark for at least 6 months out of the 12, and beat the benchmark on 56% of days. When looking at risk weighted returns, PineTree Macro had the second best returns out of all the competitors. The Sharpe Ratio (81.5%) near 100% shows that the portfolio’s returns were slightly less than expected, considering the risk that has been taken on. Yet, PineTree Macro had better performance than the benchmark and all other competitors (most of which had Sharpe Ratios well below 50%), except one. This performance can be attributed to a diversified portfolio, with a sizeable proportion of weakly correlated assets and a large proportion of uninvested cash, and a different strategy that is able to capture more returns than its competitors.
11 September 2023
This analysis was done independently by Prakhar Saxena, who is a rising junior at the University of Chicago. He is majoring in Mathematics and Economics and hopes to have a career in the quantitative side of the Finance industry, after graduating.
Notes:
[1], [2] – The data used in these tables (to calculate PineTree Macro’s returns and performance) has been taken from the portfolio’s statistics on Interactive Brokers