Don’t look for the needle in the haystack. Just buy the haystack!
-John Bogle
Ritesh Jain
Co Founder, Pinetree Macro
Macro investing is something like what John Bogle said above. We are not good in picking up needles but we know which haystack to pick and we consider it this as our edge in investing.
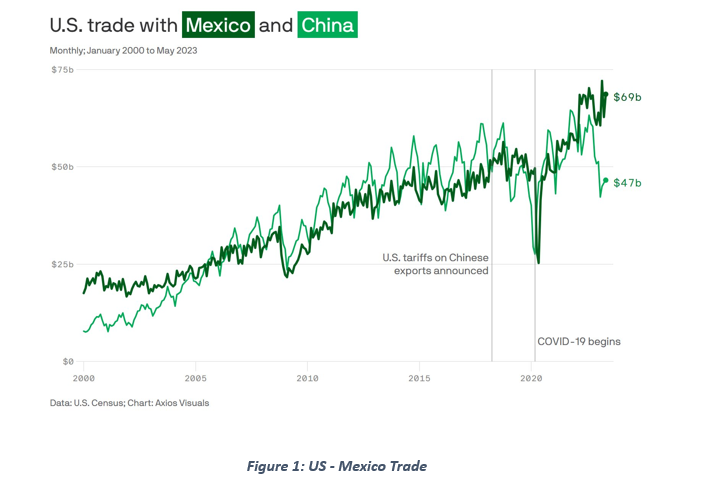
Mexican equities and Peso will be the best performing equity markets and currency in North America
When we studied US Inflation Reduction Act of 2022 (IRA) act we realised that Mexican economy will be the biggest beneficiary of IRA as the law applies to any company making nvestment in countries which form part of USMCA agreement or the United States-Mexico-Canada Agreement.
Now mega investments are going into Mexico to serve North America hence both Mexican Peso and mexican equities are turning out to be big beneficiaries. Mexico had also tamed the inflation ahead of US and Canada by raising rates aggresively. They will also be the first one to cut their rates and hence this tailwind for Mexican Peso and Mexican equities can cntinue for some more time.
Mexico-US trade is up 40% since the onset of the pandemic, whereas Chinese-US trade has plunged back to 2013 levels.
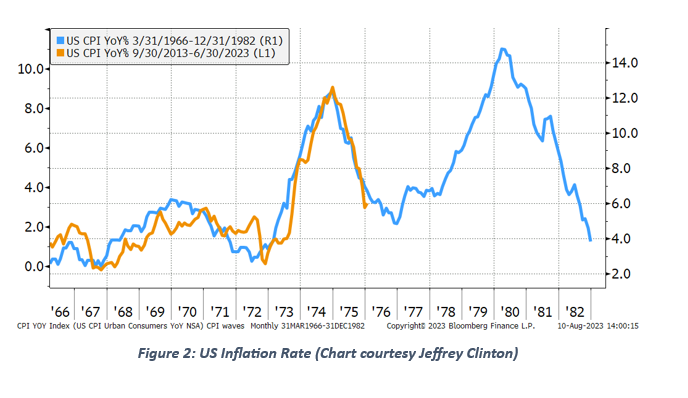
2. US Inflation
US inflation will reach a low of 3% before reaccelerating to 6% by year end
This was an easy call as supply chains were normalizing, oil was benign due to SPR release and base effect which played a big role in temporarily taming inflation. Now base effect is reversing and SPR reserves are no more available to suppress US inflation.
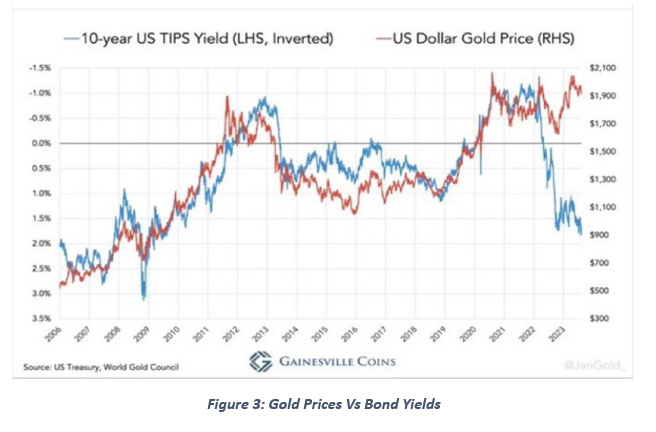
3. Gold Prices
Gold will see a high of $2400 and a low of $1650 with high towards end of the year.
I turned bullish on GOLD (although I am always bullish on GOLD personally) when US sanctioned Russia’s FX reserves but for GOLD to break out you need a soft US data and I was of the view that towards the year end we will see more data conforming our view that US economy is in recession. Spot GOLD price touched a low of $1800 (not $1650) this year and since then consolidating in a range building energy for when US data starts weakening. We still believe that we are on target of seeing $2400 this year on GOLD prices. You can see in the chart below that Gold does not care about rising US bond yields. This link got broken as soon as G-7 santioned Russia’s Fx reserves.
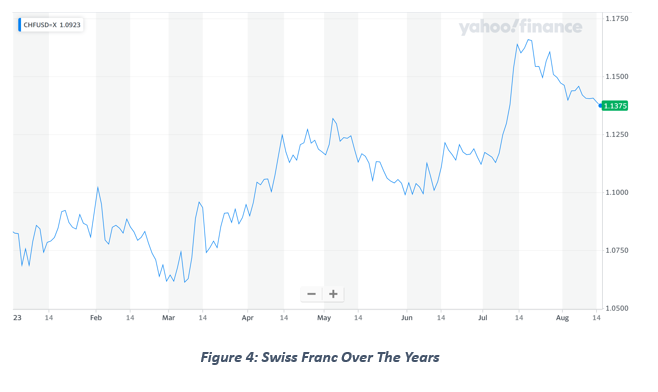
4. Swiss Franc (CHF)
Swiss franc will be the best performing G-7 currency
CHF turned out to be a safe haven and is the best performing G-7 currency YTD and we believe it will continue to remain strong for the remainder of this year. Switzerland took some heat when it sided with other G-7 countries in sanctioning Russia’s Fx reserves but it has not actively implemented measures to turn away foreign capital. Infact if there is one place still left in G-7 to park oligarchs, chinese and Saudi money then it is still Swiss Banks.
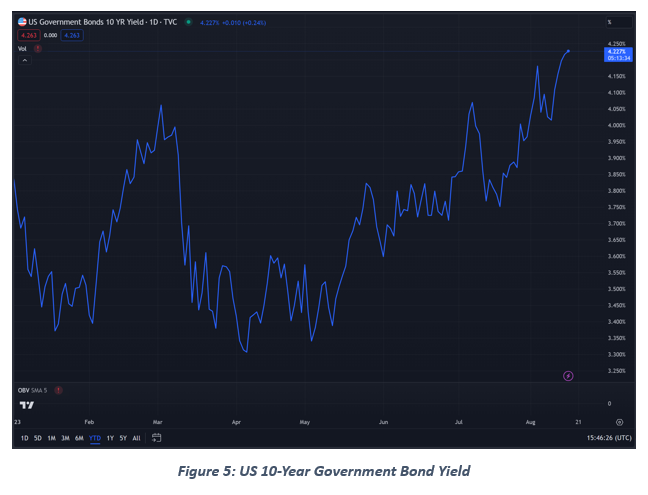
5. US Treasury
US 10-year will touch a high of 5% and a low of 2.5%
We touched a low of 3.3% and now probing high of the year. I strongly believe that we will see 5% before the end of the year. In first half of this year we had tailwind for bonds with US treasury not able to raise money from bond market due to debt ceiling and more importantly tailwind of lower inflation supported by higher base effect. Now debt ceiling has been resolved and that means US treasury will be issuing lot more bonds in an environment when inflaton will be rising again as base effect wears off.
6. Clean Energy & Battery Metals
Battery metals will see a huge bull market and Nuclear energy will gain wide acceptance as green and clean energy driving Uranium prices higher
Battery metals, specifically Lithium moved sideways in spite of increasing M&A in the sector with large companies buying out early stage mining companies to build up their portfolios for unfolding EV boom. Uranium was a different story altogether and finally market is coming around to our view that cheapest and cleanest green energy out there is Nuclear Energy. This is being helped by the supply deficit building up in Uranium exactly as demand starts shooting up.
Goehring & Rozencwajg Natural Resource Market Commentary (15th Aug 2023)
The Uranium Bull: Defying Trends and Redefining
Energy Markets – Why has uranium rallied while every other energy commodity has collapsed?
Over the past twelve months, spot uranium advanced 12% while oil, natural gas, and coal all fell anywhere from 30-70%. Our models suggest uranium’s strong performance has just started. Uranium has likely reached a pivotal inflection point that could force the price higher by as much as three- to four-fold over the next several years. For the first time in history, uranium has slipped into a persistent and widening deficit.
7. Fund Management Style
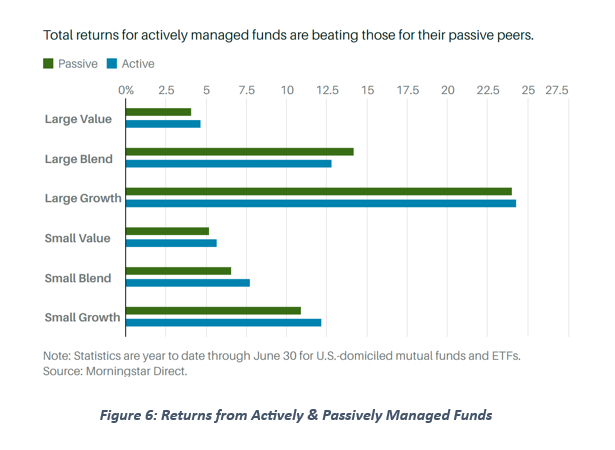
More Active fund managers will beat passive funds reversing a decade old trend
We believe this trend is still in its infancy but signs are encouraging. Rise in inflation along with real GDP leads to pricing power for non dominant companies. Add Government expenditure rising as a percentage of GDP and there you have a mixture which creates new winners. Most of these winners are not in the existing benchmarks
As Barrons notes in their 3rd July edition
Small- and large-cap stock pickers had a strong first half of 2023, challenging the conventional wisdom that index-tracking funds do better. Only large-cap blend funds struggled to beat their benchmarks, mainly because a handful of mega caps dominated, leaving more diversified funds at a disadvantage.
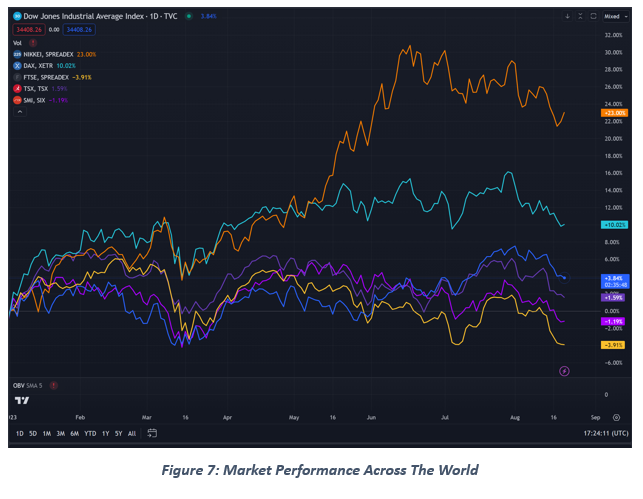
8. Winner Among the Asian Markets
Nikkei will be the best performing equity market in G-7
This was by far the easiest call I made, and it continues to play out as per our view. BOJ is the only central banker in the developed world which is doing Yield curve control. Rising inflation along with Yield curve control (YCC) leads to money moving out of bonds into real assets including equities.
Japan was already the cheapest market in developed world and Warren Buffett taking stakes in Japanese trading company holdings only made it much easier for Nikkei to rally. We were also certain that although YCC ( yield curve control) is very bullish for Japanese equities, it was equally bearish for Japanese yen as a country doing YCC normally have a weak currency. This problem was solved by our allocation to DXJ ETF (currency hedged Japan ETF) which provided us the upside of Japanese equities but did not give us the downside of owning it in Japanese yen.
9. Real Estate in UAE
UAE real estate prices will strengthen whereas Canada and Australian real estate markets will be a big loser
Ukraine Russia war led to G-7 sanctioning Russia’s Fx reserves practically confiscating it and that meant Russian oligarchs’ money and rich Chinese money specifically and broadly foreign capital would increasingly become insecure investing in jurisdictions which supported this unlawful act. The one jurisdiction which has always attracted and can absorb large pool of wealth is Dubai. Connecting our dots was easy because we only anticipate and track capital flows.
Dubai stands out among other notable property investment geographies as a tax-free location, a factor that makes it particularly attractive. This year, investor sentiment in Dubai remains outstandingly positive and the residential market continues to experience an impressive upward trend, with values increasing by 5.6 per cent in the first quarter. This marks the ninth consecutive quarter of growth, driven by strong demand for luxury second homes and the city’s emergence as a global luxury hub.
10. Indian equity markets will see single digit gain but all the action will be outside of benchmark.
Let’s first take a look at the following two statements
A high real GDP + low Inflation Favors Large cap
But a high real GDP + high inflation favors mid and small caps
I continue to be of the view that India can easily clock a nominal GDP of 12-13% in current year and also next year with roughly half of this growth coming from real GDP and another half coming from Inflation. High nominal GDP redistributes pricing power and is also beneficial for companies with high fixed costs.
We continue to be bullish on Indian equities but prefer companies outside large-cap benchmarks. Essentially we are back to stock picking as mentioned above in point Number 7. “Rise in inflation along with real GDP leads to pricing power for non dominant companies. Add Government expenditure rising as a percentage of GDP and there you have a mixture which creates new winners. Most of these winners are not in the existing benchmarks”. A key reason is the composition of current index and the extent of growth opportunities outside the index.
India has always lacked in physical infrastructure, which made it leapfrogg manufacturing and directly go into services led growth. The result has been a massive growth in the eco system of service sector including employment which spilled over into real estate in metros and more service oriented companies in major indexes. But this growth is without any increase in significant employment because certain studies estimate that services create only 20% of the jobs which manufacturing can create. Also services start booming in a middle income economy not a low income economy.
India has got one more chance to turn into a manufacturing hub due to China+1 policy. The “China Plus One” strategy refers to a business strategy adopted by companies, especially multinational corporations, to diversify their production and supply chain activities by adding an alternative manufacturing or sourcing location to China. India is the preferred choice. This will lead to wealth, employment and profit accretion in manufacturing eco system supported by govt action whereas services will incrementally support rather than dominate. This is the reason that I continue to be bullish on tier 2 towns and cities and also companies outside the benchmarks. India is going to be a heaven for stock pickers who can adjust to this big picture. So forget Large caps, forget indexes, incremental wealth creation will continue to be in mid and small caps.
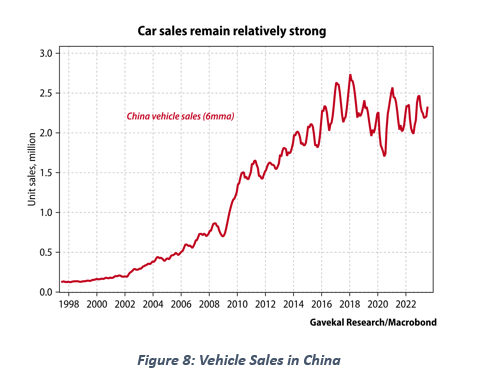
11. Chinese household consumption will save global economy from going into deep recession
Chinese household continues to hold really well considering that President Xi said that “ Housing is not for speculation” and he meant it. If we add the crackdown on chinese tech then China is now uninvestible till they rebalance their economy from housing speculation and bring down the inequality.
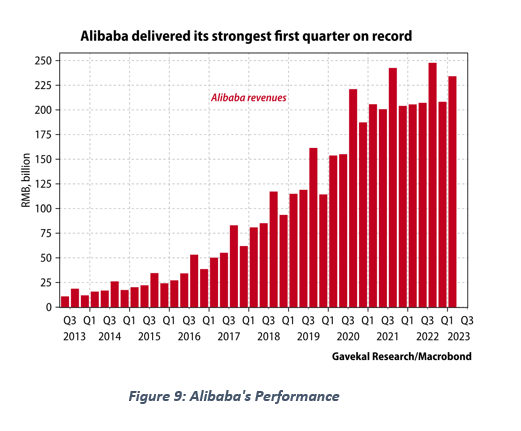
Meanwhile, China’s consumer-facing e-commerce sales continue to chug along nicely. This year, Alibaba delivered its strongest first quarter in history, with revenues 10 times what they were seven years ago. So Chinese consumer continues to be strong… it is just not reflected in the indices.
Conclusion
This is how we connect the dots. We only take top-down approach and then allocate to the respective ETFs to benefit from the trend. As you can read above that we do get the trends right, but we cannot time the trends and sometimes we are too early. We understand that “early” means “wrong” hence individual asset allocation is of utmost importance when constructing the portfolio.
The below performance report is an extract from Pinetree Macro Annual performance report which is published separately
Portfolio Performance Analysis
To analyze PineTree Macro’s performance, first we have to come up with a benchmark. The benchmark chosen in this case is a composite of Vanguard Total World Stock Index Fund (VT), VanEck Inflation Allocation ETF (RAAX) and Vanguard Total Bond Market Index Fund (BND) where we weight them equally:
Benchmark = (1/3)*VT + (1/3)*RAAX + (1/3)*BND
This is a good benchmark as it equally weights the most important assets that people invest in – stocks, bonds and inflation fighting assets (for example, commodities like gold).
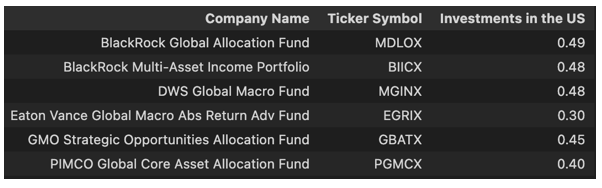
I also selected some relevant competitors for PineTree Macro. These can be categorized as mutual fund that make investments based on macroeconomic signals. I selected these based on their investment strategies and the proportion of assets they had invested in the United States, aiming for about 30% – 50% compared to PineTree Macro’s roughly 50%. I used Refinitiv Workspace to find these competitors and look at their investment compositions. I was able to find 7 such portfolios, from mutual funds, which are also listed and tracked publicly on exchanges. This is a list of the selected competitors:
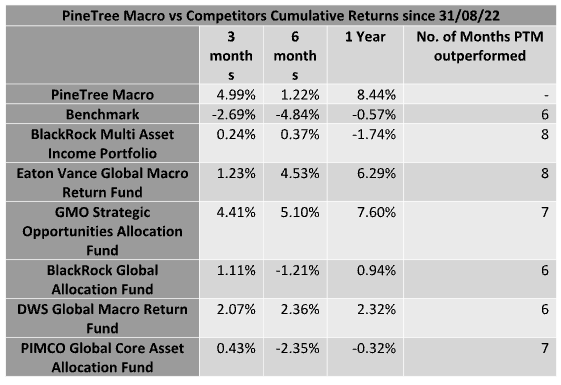
When comparing PineTree’s performance over the past year against the benchmark and these competitors we get the following results:
This table shows that PineTree Macro has outperformed all other competitors and the benchmark in terms of cumulative returns, over the whole year. PineTree Macro also had higher returns for 6+ months out of 12, versus the benchmark and the competitors.
Independent Analysis by Prakhar Saxena, a rising junior at the University of Chicago. He is majoring in Mathematics and Economics and hopes to have a career in the quantitative side of the Finance industry, after graduating.
Pine Tree Macro Pvt Ltd (“Pine Tree”): This information provided is for the exclusive and confidential use of the addressee only. Any distribution, use or reproduction of this information without the prior written permission of Pine Tree is strictly prohibited. The information and any material provided in this document or in any communication containing a link to Pine Tree’s website is not intended for distribution to, or use by, any person or entity in any jurisdiction or country where such distribution or use would be contrary to law or regulation or which would subject Pine Tree to any registration requirement within such jurisdiction or country. Neither the information, nor any material or opinion contained in this document constitutes a solicitation or offer by Pine Tree or its, directors and employees to buy or sell any securities, futures, options or other financial instruments or provide any investment advice or service. We do not represent that the information and any material provided on this website is accurate or complete. Pine Tree makes every effort to use reliable, comprehensive information; but makes no representations or warranties, express or implied or assumes any liability for the accuracy, completeness, or usefulness of any information contained in this document. All investments are subject to market risks. In no event will Pine Tree or its directors and employees be liable for any damages including without limitation direct or indirect, special, incidental, or consequential damages, losses or expenses arising out of and in connection with this website, or in connection with any failure of performance, error, omission, interruption, defect, delay in operation or transmission, computer virus or system failure.
Anantam International SPC Fund (“Fund”) & Aparna Investment Management (“Manager”) : This report does not constitute an offer to sell, nor a solicitation of an offer to buy, interests in Anantam International SPC Fund and is not intended to create any rights or obligations
Aparna Investment Management shall not accept any liability if this report is used for an alternative purpose from which it is intended, nor to any third party in respect of this report. While all reasonable care has been taken in preparing this report, no responsibility and liability is acceptable for errors of fact or for any opinion expressed herein
The Anantam International SPC Fund and/or any of its officers, directors, personnel and employees shall not be held liable and responsible for any loss, damage of any nature, including but not limited to direct, indirect, incidental, punitive, special, exemplary, consequential, as also any loss of profit, revenue in any way arising from or in connection with the use of this statement in any manner whatsoever.
Past performance is not indicative of future results. The Anantam International SPC Fund does not provide any assurances as to the reliability of such information and you should not rely on this information when making an investment decision.
Opinions, projections and estimates contained in this report are subject to change without prior notice.